Probability & Statistics Fundamentals: Part I
Disclaimer: The notes and images from this post were taken from the books/works listed in the References section. The intention of this post is to provide a summary of Probability & Statistics.
Random Variables
A random variable can be seen as the name of an experiment with a probabilistic outcome. It’s value is the outcome of that experiment - Tom Mitchell, 1997
Definitions
Definition 1:
A random variable is a function that assigns a real number to each outcome in the sample space of a random experiment [1].
Definition 2:
For a given sample space $\mathcal{S}$ of some experiment, a random variable (rv) is any rule that associates a number with each outcome in $S$. In mathematical language, a random variable is a function whose domain is the sample space and whose range is the set of real numbers [2].
A random variable is denoted by an uppercase letter such as $X$. After an experiment is conducted, the measured value of the random variable is denoted by a lowercase letter such as $x = 70$ milliamperes.
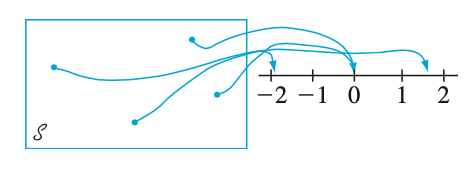 Figure 1: A Random Variable Example
In summary:
A discrete random variable is a random variable with a finite range.
A continuous random variable is a random variable with an interval of real numbers for its range.
Discrete Random Variable and Probability Distributions
The probability distribution of a random variable X is a description of the probabilities associated with the possible values of X.
For a discrete random variable, the distribution is often specified by just a list of the possible values along with the probability of each. In some cases, it is convenient to express the probability in terms of a formula.
Probability Mass Function
For a discrete random variable $X$, its distribution can be described by a function that specifies the probability at each of the possible discrete values for $X$
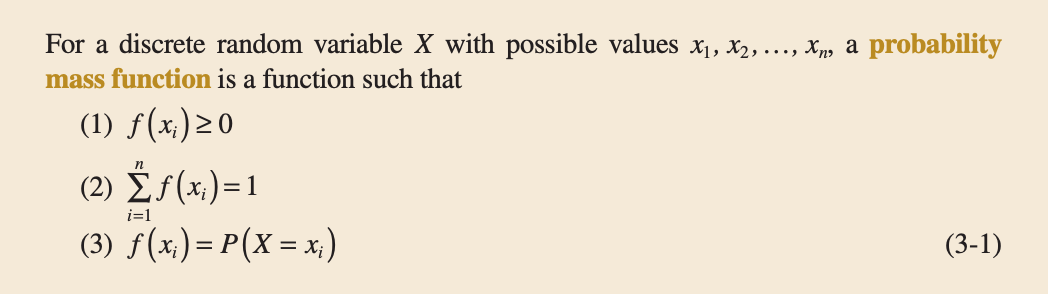 Figure 2: Probability Mass Function Definition
The next Figure, shows an example of a probability mass function:
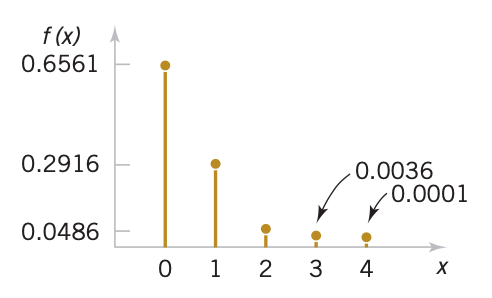 Figure 3: Probability Mass Function Example
Cumulative Distribution Functions
In general, for any discrete random variable with possible values $x_1,x_2,…,$ the events ${X = x_1}, {X = x_2},…$ are mutually exclusive. Therefore, $P(X \leq x) = \sum_{x_i \leq x} P(X = x_i )$. This leads to the following definition:
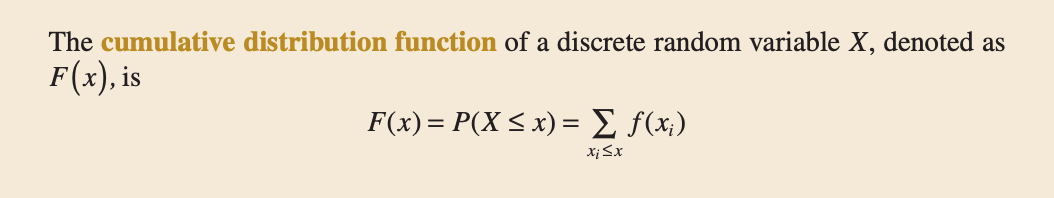 Figure 4: Cumulative Distribution Function
A cumulative distribution function satisfies the following properties:
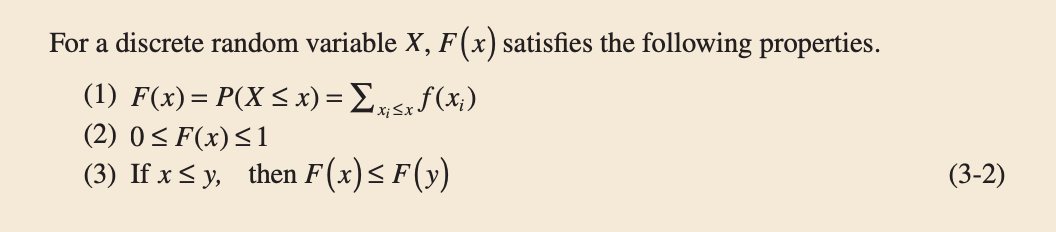 Figure 5: Cumulative Distribution Function
Mean and Variance of a Discrete Random Variable
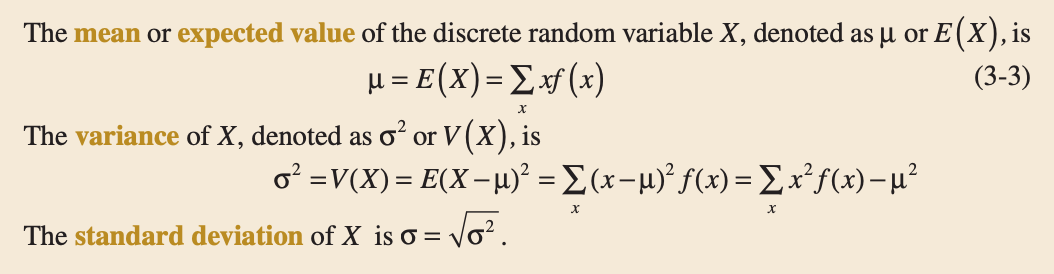 Figure 6: Mean, Variance, and Standard Deviation of Discrete Random Variable
The mean of a discrete random variable $X$ is a weighted average of the possible values of $X$ with weights equal to the probabilities. If $f(x)$ is the probability mass function of a loading on a long, thin beam, $\mathbb{E}(X)$ is the point at which the beam balances. Consequently, $\mathbb{E}(X)$ describes the “center” of the distribution of $X$ in a manner similar to the balance point of a loading.
The variance of a random variable $X$ is a measure of dispersion or scatter in the possible values for $X$. The variance of $X$ uses weight $f(x)$ as the multiplier of each possible squared deviation $(x − \mu)^2$. The variance of a random variable $X$ can be considered to be the expected value of a specific function of $X$, namely, $h(X)= (X − \mu)^2$.
In general, the expected value of any function $h(X)$ of a discrete random variable is defined in a similar manner.
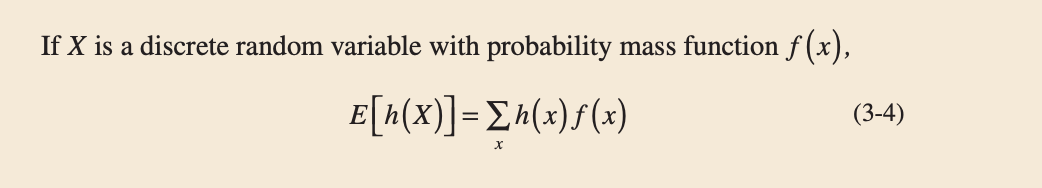 Figure 7: Expected Value of a Function of a Discrete Random Variable
Continuous Random Variable and Probability Distributions
A continuous random variable is a random variable with an interval (either finite or infinite) of real numbers for its range.
Because the number of possible values of $X$ is uncountably infinite, $X$ has a distinctly different distribution from the discrete random variables.
Probability Density Function
A probability density function $f(x)$ can be used to describe the probability distribution of a continuous random variable $X$. If an interval is likely to contain a value for $X$, its probability is large and it corresponds to large values for $f(x)$. The probability that $X$ is between $a$ and $b$ is determined as the integral of $f(x)$ from $a$ to $b$.
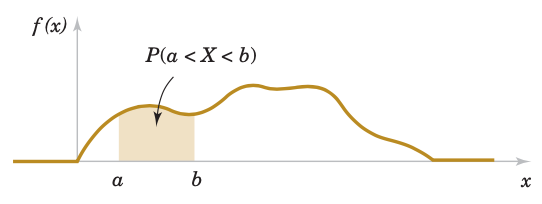 Figure 8: Probability Determined from the area under $f(x)$
A probability density function (pdf) provides a simple description of the probabilities associated with a random variable. A pdf is zero for x values that cannot occur, and it is assumed to be zero wherever it is not specifically defined.
The important point is that $f(x)$ is used to calculate an area that represents the probability that $X$ assumes a value in $[a, b]$
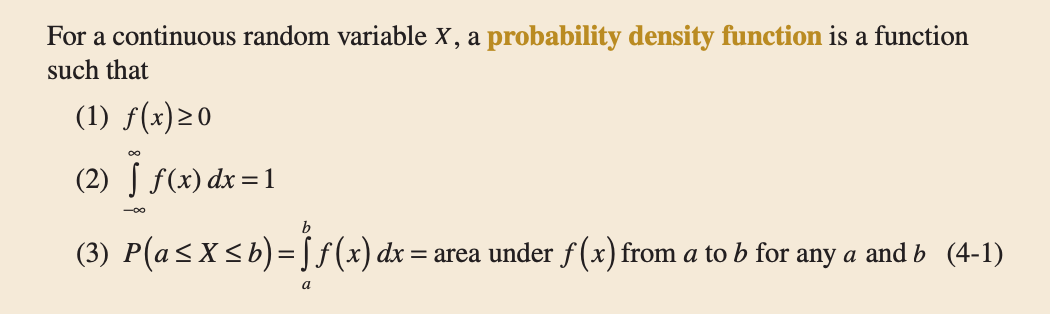 Figure 9: Probability Density Function Properties
Cumulative Distribution Functions
An alternative method to describe the distribution of a continuous random variable can also be use in the same way as for discrete random variables. The cumulative distribution function is defined for all real numbers.
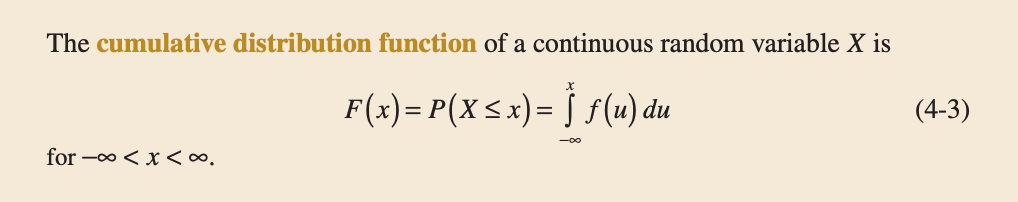 Figure 10: Cumulative Distribution Function for a Continuous Random Variable
The probability density function of a continuous random variable can be determined from the cumulative distribution function by differentiating. The fundamental theorem of calculus states that
\[\begin{equation} \frac{d}{dx}\int_{-\infty}^{x}f(u)du = f(x) \end{equation}\] Figure 11: Probability Density Function from the Cumulative Distribution Function
Mean and Variance of a Continuous Random Variable
For a continuous random variable, integration replaces summation used in the discrete definitions.
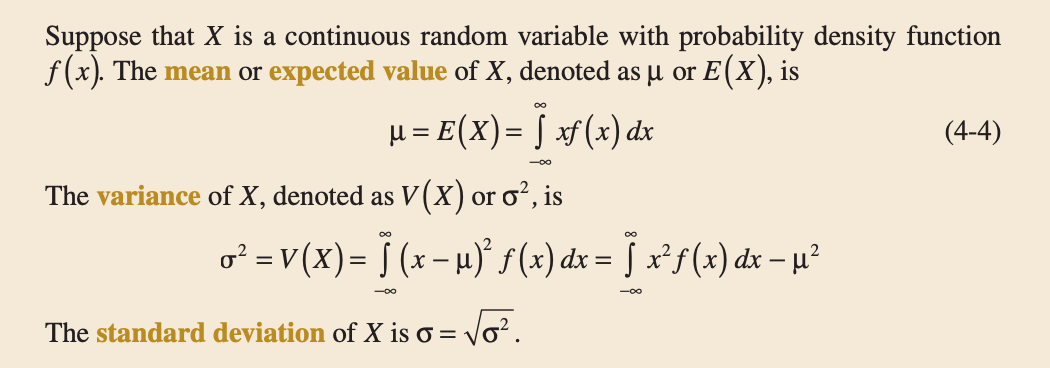 Figure 12: Mean, Variance, and Standard Deviation of a Continuous Random Variable
The expected value of a function $h(X)$ of a continuous random variable is also defined in a straightforward manner.
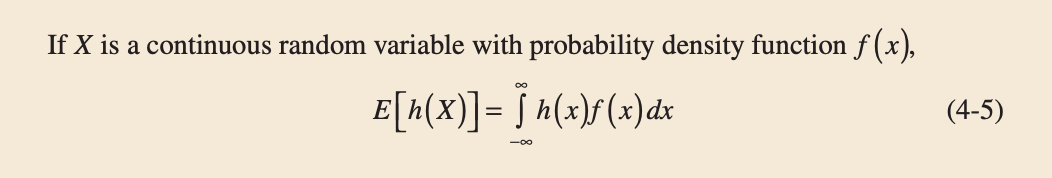 Figure 13: Expected Value of a Function of a Continuous Random Variable
In the special case that $h(X) = aX+b$, for any constants $a$ and $b$, $\mathbb{E}[h(X)] = a \; \mathbb{E}(X)+ b$. This can be shown from the properties of integrals.
References
MONTGOMERY, Douglas C.; RUNGER, George C. Applied statistics and probability for engineers. John Wiley & Sons, 2010.
DEVORE, Jay L. Probability and Statistics for Engineering and the Sciences. Cengage learning, 2011.